| information is entropic spread |
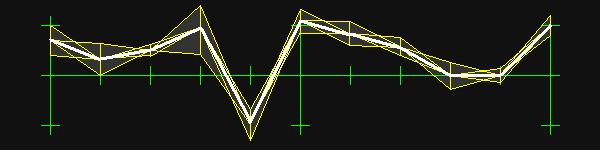
I suggest simply plotting the central line, and the upper and lower sigma lines - but of course the interpolation cannot include the latter as these do not exist: no data-sample was taken between adjacent data-samples ... I propose plotting the cross-to center lines, weaving alternately between sigma points and adjacent central points, thus indicating a narrower interpolated sigma.
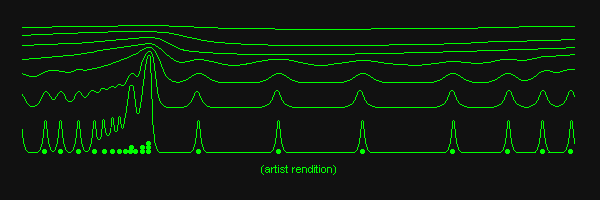
A method for visualing histogram data where significant points are singular captures in the temporal domain not usually by coincidence-buckets, is to use a "mesa-canyon" plot viewed from above-front, with horizontal contours of (Gaussian) normal curves fit to each point, monotonically progressive frequency in the image-depth dimension, with the raw temporally-spaced data points in the low-foreground canyon floor; the broad average on the background mesa. Essentially three dimensional, allowing inspection up the canyons, to find the significant "event-clustering". The ("Gaussian") normal distribution curve converges quickly to smooth with minimal waviness between specific data points. (Further research is in progress to determine the ideal curve for fastest smoothing.)
A premise discovery under the title,